 (A 4.7-Tesla horizontal-bore superconducting magnet for small animals)
Chemists have long used NMR spectroscopy to study the structure of chemicals. Usually (1) the samples are Pasteur-pipetted into a small diameter NMR tube (e.g., 5-mm or less), and (2) to improve S/N, the acquisition time is deliberately long to allow more signal averages. For the biochemists, the only possible application is to analyze PCA (perchloric acid) tissue extracts (through a procedure that requires a mortar and pestle and loads of liquid nitrogen and elbow grease). Studies of living tissues are obviously out of the question; although even PCA extracts can provide interesting NMR spectra.
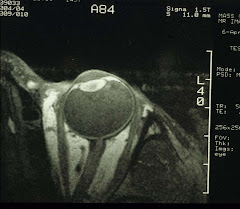
It is unclear who first convinced manufacturers of NMR spectrometers that size did matter and that many biological applications were still waiting in the wings. By the mid-1980s, there was a proliferation of wide-bore high-field superconducting magnets, both vertical and horizontal. All of a sudden, in-vivo and ex-vivo experiments can now be performed. With the additional bore space, simple perfusion systems can be integrated that can maintain cell/tissue/organ viability inside the magnet. And anesthetized small animals, such as mice, rats, and rabbits, can be comfortably fitted into the bore of, e.g., a 4.7-Tesla magnet (see image at top). In time, spectrometers capable of imaging also become available thus completing the entire application of biological NMR. And whatever happened to the NMR jocks (those within our circle, of course)? As far as we know, some are still shimming (bigger and better) magnets, while others become neuroradiologists, and at least four are practicing ophthalmologists.
For eye doctors who happen to be interested in diabetic cataract formation, the 10-mm probe is ideal as it allows studies of intact rabbit lenses which coincidentally are each around 10mm in diameter. Or, 10-12 rat lenses can be grouped together and regarded as one lens. These lenses can be placed in a 10-mm NMR tube filled with incubating medium and they will stay viable during signal acquisition. Further, the medium can be prepared with normal (5.5mM) or high (35.5mM) glucose (or other sugar substrates), the latter to simulate hyperglycemia.
NMR spectroscopy not only confirms old findings but often provides new information. The latter is akin to witnessing the discovery of something new "for the first time in human history". Some examples are shown below:
 The above is a 31P spectrum of normal rat lenses (age of the animals: 8-10 months). It shows low levels of S3P (sorbitol-3-phosphate), F3P (fructose-3-phosphate), and αGP (α-glycerophosphate), and relatively high levels of PCh (phosphorylcholine), Pi (inorganic phosphate), GPC (glycerophosphorylcholine), and ATP.
One week after diabetic induction (by using streptozotocin), there is a huge increase of S3P, F3P, and αGP:
 And if the the diabetic rats are treated with an oral AR (aldose reductase) inhibitor to stop sorbitol production, then the spectrum normalizes. In fact, both S3P and F3P now disappear entirely.
S3P and F3P are both novel metabolites never seen before. In fact, to this day, we still don't know their roles in diabetic cataractogenesis. They are also present in the red cells of human diabetics for reasons unknown.
In addition, in rat lenses incubated in high glucose, there is production of sorbitol (and some fructose) with time as evidenced by the following 13C spectra (top: one-month-old rat lenses and bottom, old rat lenses):
 On the other hand, no mannitol is produced in lenses incubated in high mannose:
 Does this mean that mannose can be used as a sweetener for the diabetics? Perhaps. Mannose, in fact, does taste quite sweet. Although, as they often say: more studies are needed.
Structurally, mannose and glucose differ only in C-2, different enough for AR not to recognize and metabolize it:
 Of course, there are numerous other ocular diseases that can be examined with NMR. For example, the much dreaded bacterial endophthalmitis after cataract surgery. In rabbits, intraocular Streptococcus pneumoniae caused appearance of lipids in the vitreous, suggesting a breakdown in the blood-ocular barrier:
 On the left are proton spectra of the normal eye/vitreous dominated by the lactate resonance (at 1.35ppm). The infected eye/vitreous shows, in addition to lactate, methylene (1.15ppm) and methyl (0.83ppm) groups of lipids, over a span of 2-4 days. By the 10th day, the eye becomes phthitic.
Here we should point out that the concentration of water is 55.6M. Such a high concentration is great for MRI. In NMR spectroscopy, however, water-protons easily overwhelm other proton resonances. For the investigation of metabolites with a concentration in the mM range, water-suppression is therefore necessary. The above spectra were acquired by pre-saturating water signals, one of the half a dozen or so techniques.
So how do we go from NMR spectroscopy to MRI? Very simple, it is all in spatial encoding. To illustrate this point, we shall next examine MR microscopy and chemical-shift imaging.


No comments:
Post a Comment