Thursday, May 22, 2008

8.4 Four-dimensional NMR spectroscopy

Yes, everybody knows that: we all live in a magnetic field - the Earth. Its field strength is a mere 30-60 micro Tesla (depending on where you live). However, a large metal tube such as a submarine deep in the ocean can cause magnetic disturbances and is therefore detectable. Rumor has it that a certain U-Boat captain founded an NMR company, most likely inspired by his wartime experience evading MADs (magnetic anomaly detectors). A submarine can become electrically charged owing to the difference in the temperature of the upper and lower hull. This is enough to create a difference in salinity of the enclosing sea water, hence a dynamic electric field around "Das Boot". A stealth submarine will have to address this issue obviously. In NMR, shielding high-field magnets is a challenge even now. Incidentally, Mr Tom Clancy has much more on anti-submarine warfare in his classic "The Hunt for Red October" (which most people on Earth have already read):
Back to the issue at hand: At some point in the not so distant future, the full potential of biological NMR will finally be realized. And it will be in the form of 4-dimensional (three spatial and one chemical-shift) NMR spectroscopy. In other words, imaging of, not just the water-protons, but the far more informative metabolites. The limiting factor is, yep, you've guessed it, the magnetic field strength.

Now picture yourself inside a magnet with a set of antennas enclosing your head. And after a certain period of rf irradiation at proton Larmor frequency and FID signal collection and processing, you are ready for the result. And it'll be a spectrum with only a large water peak. That won't be so interesting at all, will it. So, how is an MR image constructed?

Very simple, the FIDs must be encoded in three dimensions. First, along the direction of the north-south direction (the z-axis) of the magnetic field, a field gradient (i.e., the z-gradient) is applied. This gradient causes the Larmor frequency to change linearly, and a slice is selected by choosing the rf frequency corresponding to the Larmor frequency of the center of that slice. For this slice, a preparation gradient, the y-gradient, is then applied for frequency encoding, followed by the x-gradient for phase-encoding. Finally, a 2D Fourier Transform is used to transform the encoded image into the spatial domain. Why the need for a slice? Answer: to make sure enough signals are generated. A single layer of nuclei will have almost negligible signals to work with. [Note: For more information on important aspects of MRI, we recommend this site: http://mritechnicianschools.net].

Present-day clinical MRI is mostly imaging of water-protons. For the ultimate 4-dimensional NMR spectroscopy, an example is shown below:

Again, using an old standby: a rabbit lens (10-mm diameter and 5-mm thickness) incubated for 28 hours in high glucose for maximal sorbitol production. 13C1-glucose was used as the substrate. And NMR experiments were performed using a 9.4-Tesla spectrometer.

Part 1. MR microscopy:

Top: Schematic diagrams of the lens. The two primary regions are the cortex and the nucleus. (Left): section through the anterior-posterior poles and (Right): section through the equatorial plane.

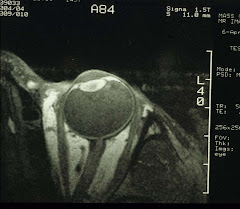
Bottom: A water-proton image, through the equatorial plane, acquired with a spin-echo pulse sequence with TE (echo time)/TR (repetition time) = 3.88/1000ms, a 126x128 matrix, and 32 averages. Image resolution was 40 x 40 x 500 micron.

Part 2. Chemical-shift 13C microscopy:

At the bottom is a 13C spectrum acquired at 100.61MHz without proton decoupling - hence the multiplets of the biochemicals.

And the top shows color-coded images of glucose (red), sorbitol (yellow), and lactate (purple), respectively. The images were acquired with spin-echo of TE/TR = 9/500ms over 8 hours. A narrow bandwidth selective pulse (4KHz) was used with z-gradient = 800Hz/mm (slice thickness = 5mm). All three metabolites resonated within this bandwidth. The in-plane resolution was 600 x 600 micron. From the images, it is clear that there is a glucose concentration gradient with higher glucose in the cortex. And in contrast, sorbitol appears to re-distribute into the nucleus even though it is produced mostly in the cortex.

Obviously the above still cannot be done on humans. However, 7-Tesla clinical imagers are now coming on line. It is really only a matter of time before the manufacturers start seeking FDA approval for these imagers. For now, an alternative is to collect NMR spectra from, e.g., selected areas of the brain. It is possible to acquire somewhat low-resolution 31P, water-suppressed proton, and even 13C spectra at 1.5 Tesla - the most common magnet field strength used in a clinical setting today.
(Source: http://www.ajnr.org/cgi/content/full/23/8/1387)

In the above example, Cho (choline), Cr (creatine), and NAA (N-acetyl aspartate) are clearly seen. Each spectrum is from a volume of interest of 100 x 80 x 15 mm with an acquisition time of 60 min. [Note: A little long, but not intolerable from personal experience. Despite the loud knocking noises from turning gradients, some are known to doze off in the magnet.]

So, here is the current situation: MRI using 1.5-Tesla body scanners has matured as a routine clinical procedure. However, to see the metabolites, the only practical approach is to acquire NMR spectra from a volume of interest in the brain (or other body parts). This is in-vivo NMR spectroscopy, also known as MRS (magnetic resonance spectroscopy). Again, with ultra-high-field clinical magnets now rapidly becoming available, we should expect high-resolution MRS and perhaps even chemical-shift imaging soon.

For the eye, we will need to make some adjustment. Instead of the body or the head coil, we use a home-made surface coil that transmits and receives rf. Typically, it is a single-turn 1-inch coil that covers the whole eyeglobe:
It is then possible to obtain high-resolution MR images of the eye and water-suppressed proton spectra of the vitreous. Again, for the time being.

Tuesday, May 20, 2008

8.3 For the first time in human history

(A 4.7-Tesla horizontal-bore superconducting magnet for small animals)

Chemists have long used NMR spectroscopy to study the structure of chemicals. Usually (1) the samples are Pasteur-pipetted into a small diameter NMR tube (e.g., 5-mm or less), and (2) to improve S/N, the acquisition time is deliberately long to allow more signal averages. For the biochemists, the only possible application is to analyze PCA (perchloric acid) tissue extracts (through a procedure that requires a mortar and pestle and loads of liquid nitrogen and elbow grease). Studies of living tissues are obviously out of the question; although even PCA extracts can provide interesting NMR spectra.

It is unclear who first convinced manufacturers of NMR spectrometers that size did matter and that many biological applications were still waiting in the wings. By the mid-1980s, there was a proliferation of wide-bore high-field superconducting magnets, both vertical and horizontal. All of a sudden, in-vivo and ex-vivo experiments can now be performed. With the additional bore space, simple perfusion systems can be integrated that can maintain cell/tissue/organ viability inside the magnet. And anesthetized small animals, such as mice, rats, and rabbits, can be comfortably fitted into the bore of, e.g., a 4.7-Tesla magnet (see image at top). In time, spectrometers capable of imaging also become available thus completing the entire application of biological NMR. And whatever happened to the NMR jocks (those within our circle, of course)? As far as we know, some are still shimming (bigger and better) magnets, while others become neuroradiologists, and at least four are practicing ophthalmologists.

For eye doctors who happen to be interested in diabetic cataract formation, the 10-mm probe is ideal as it allows studies of intact rabbit lenses which coincidentally are each around 10mm in diameter. Or, 10-12 rat lenses can be grouped together and regarded as one lens. These lenses can be placed in a 10-mm NMR tube filled with incubating medium and they will stay viable during signal acquisition. Further, the medium can be prepared with normal (5.5mM) or high (35.5mM) glucose (or other sugar substrates), the latter to simulate hyperglycemia.

NMR spectroscopy not only confirms old findings but often provides new information. The latter is akin to witnessing the discovery of something new "for the first time in human history". Some examples are shown below:
The above is a 31P spectrum of normal rat lenses (age of the animals: 8-10 months). It shows low levels of S3P (sorbitol-3-phosphate), F3P (fructose-3-phosphate), and αGP (α-glycerophosphate), and relatively high levels of PCh (phosphorylcholine), Pi (inorganic phosphate), GPC (glycerophosphorylcholine), and ATP.

One week after diabetic induction (by using streptozotocin), there is a huge increase of S3P, F3P, and αGP:

And if the the diabetic rats are treated with an oral AR (aldose reductase) inhibitor to stop sorbitol production, then the spectrum normalizes. In fact, both S3P and F3P now disappear entirely.

S3P and F3P are both novel metabolites never seen before. In fact, to this day, we still don't know their roles in diabetic cataractogenesis. They are also present in the red cells of human diabetics for reasons unknown.

In addition, in rat lenses incubated in high glucose, there is production of sorbitol (and some fructose) with time as evidenced by the following 13C spectra (top: one-month-old rat lenses and bottom, old rat lenses):
On the other hand, no mannitol is produced in lenses incubated in high mannose:
Does this mean that mannose can be used as a sweetener for the diabetics? Perhaps. Mannose, in fact, does taste quite sweet. Although, as they often say: more studies are needed.

Structurally, mannose and glucose differ only in C-2, different enough for AR not to recognize and metabolize it:
Of course, there are numerous other ocular diseases that can be examined with NMR. For example, the much dreaded bacterial endophthalmitis after cataract surgery. In rabbits, intraocular Streptococcus pneumoniae caused appearance of lipids in the vitreous, suggesting a breakdown in the blood-ocular barrier:

On the left are proton spectra of the normal eye/vitreous dominated by the lactate resonance (at 1.35ppm). The infected eye/vitreous shows, in addition to lactate, methylene (1.15ppm) and methyl (0.83ppm) groups of lipids, over a span of 2-4 days. By the 10th day, the eye becomes phthitic.

Here we should point out that the concentration of water is 55.6M. Such a high concentration is great for MRI. In NMR spectroscopy, however, water-protons easily overwhelm other proton resonances. For the investigation of metabolites with a concentration in the mM range, water-suppression is therefore necessary. The above spectra were acquired by pre-saturating water signals, one of the half a dozen or so techniques.

So how do we go from NMR spectroscopy to MRI? Very simple, it is all in spatial encoding. To illustrate this point, we shall next examine MR microscopy and chemical-shift imaging.

Saturday, May 17, 2008

8.2 NMR

One wonders if both Felix Purcell (1912-1997) and Edward Bloch (1905-1983) had experimented with magnets (see above) when they were little. They did, however, share the Nobel Prize in Physics in 1952 for independently creating experiments for the observation of NMR (nuclear magnetic resonance).

The growth of NMR research especially in the past two decades is nothing short of spectacular. It is a field driven entirely by the magnetic field strength (B0) which determines the operational frequency or Lamor frequency (ω0) of the NMR nuclei. The equation central to NMR research is this:
ω0 = γB0

γ is of course the immutable gyromagnetic ratio (or magnetogyro ratio - depending on whether you are a physicist or a chemist) unique to each NMR nucleus. The table below is a quick glance of the Larmor Frequency at a field strength of 1 Tesla (last column on the right):

ParticleSpin
wLarmor/B
s-1T-1
n/B
Electron
1/2
1.7608 x 10¹¹
28.025 GHz/T
Proton
1/2
2.6753 x 10⁸
42.5781 MHz/T
Deuteron
1
0.4107 x 10⁸
6.5357 MHz/T
Neutron
1/2
1.8326 x 10⁸
29.1667 MHz/T
23Na
3/2
0.7076 x 10⁸
11.2618 MHz/T
31P
1/2
1.0829 x 10⁸
17.2349 MHz/T
14N
1
0.1935 x 10⁸
3.08 MHz/T
13C
1/2
0.6729 x 10⁸
10.71 MHz/T
19F
1/2
2.518 x 10⁸
40.08 MHz/T
(Note: the study of electron spin is ESR - Electron Spin Resonance or now known as EPR - Electron Paramagnetic Resonance - an entirely different ballgame from NMR)

In the old days, field strength was represented by proton frequency. For example: what was a 400MHz (or megacycle) magnet is now known as a (400/42.5781=)9.4 Tesla magnet. Because of the notoriously low sensitivity of NMR nuclei, much improvement in signal generation relies on increasing the magnetic field strength. The higher the field strength, the more the signal intensity (or higher signal-to-noise ratio). For example, for proton, an increase from 300 to 400MHz yields an improvement in S/N of (400/300)2 = 1.78 fold. Building ultra-high-field magnets is a competitive sport for the manufacturers of course.

What are these NMR nuclei? Well, any nucleus with an odd number of protons or neutrons (or combination) qualifies; for example, biologically relevant nuclei include 13C, 31P, 1H (proton), 23Na, 17O, 15N, 19F, and deuterium (a nucleus with spin number I=1). Of these, 31P and 23Na are both 100%, and 1H 99.98% naturally abundant. The others are only a fraction of around 1% or less and are usually used as labels; for example, 13C can be labeled at either C-1 or C-6 position of glucose and the glycolytic products can thus be traced. On the other hand, proton is part of the ubiquitous water molecule, and 31P that of ATP and other organophosphates.

All these nuclei when placed in a magnetic field will precess at certain ω0: depending on the γ of each nucleus, as mentioned above:
(From: teaching.shu.ac.uk/hwb/chemistry/tutorials/molspec/nmr1.htm)

If a radiofrequency (rf) perpendicular to the north-south direction, or conventionally, the z-axis of the magnetic field is applied at the frequency of a nucleus of interest, then this nucleus will be tipped into the x-y plane. When the rf is turned off, the nucleus will begin to return to its original ground state through a process, known as relaxation. Relaxation is defined by longitudinal relaxation time (T1) and transverse relaxation time (T2). And the signals produced in the rf field are known as the FIDs (free induction decays) which can be picked up by an antenna and processed (through Fourier Transform from time into frequency domain) to generate NMR spectra.
(Note: No Bruker share-holders here)

The above is a typical high-field vertical-bore superconducting magnet used in NMR spectroscopy. It requires periodic feeding of liquid nitrogen and liquid helium. A probe is inserted from the bottom and the sample (in an NMR tube) loaded from the top, controlled by compressed air. A computer console is situated nearby for shimming, pulse sequence delivery, signal collection, spectral generation and printing.

An NMR probe is the heart of the spectrometer, it fits vertically into the bore of the magnet. They come in different bore sizes as well, e.g., 2, 5, 10, and 20mm diameters are common. These probes can be broadband or single frequency.

Before insertion, it needs to be optimized by using tuning and matching rods with the aid of an oscilloscope. Tuning is simply to make sure the probe is set to the frequency of interest. And matching is to ensure the impedance is equal to the external electronic circuitry so that maximal power can be transferred. These two operations are actually inter-related:

Shimming is an art, its purpose is to maximize the magnetic field homogeneity which greatly affects spectral resolution. Some "NMR jocks" are known to take extraordinarily long time (e.g., forever) to shim the magnet - to perfection. And a lot of them know how to read the FIDs even before FT. The resulting spectra are often strikingly well-resolved. NMR jocks are a special breed. Much like computer hackers, NMR jocks also survive on pizza and coke, except the food and drink are paid for with cash, as their credit cards are usually erased by the magnets. (Try and explain this to the pizzeria owners.)

Next, we will examine a few examples of NMR spectroscopy of ocular tissues - before entering the field of MRI (magnetic resonance imaging).

Tuesday, May 13, 2008

8.1 Brain is an extension of the eyes

(The visual pathway - looking from the base of the brain)

The visual pathway of course travels all the way from the eyes to the back of the brain (see above, in red). Anything untoward that occurs along the pathway will manifest as an ophthalmic problem. And in addition to the second cranial nerve, the extraocular muscles are innervated by the third, 4th and 6th cranial nerves. Plus, the pupillary responses are controlled by yet another set of nervous pathway. Neuro-ophthalmology is indeed a very interesting and challenging field. With very simple tools, such as a penlight, an occluder, a tangent screen and/or perimeter, definitive diagnosis often can be reached. With time, more tools become available. And brain imaging is now consisted of many modalities:

(From socialfiction.org)

These modalities include the old standby CT, the re-vamped PET, the anatomical MRI and the more powerful fMRI (f=functional), and a close relative of fMRI, the Optical Imaging of Intrinsic Signals (OIS). (Note: Cryo is imaging of frozen brain in slices, not for the living.)

Of these, we will go into more about MRI, in order to discuss important subjects such as "perivenous syndrome" and "brain plasticity". And to understand MRI, we will need to start from its humble beginning, NMR. Next post is therefore "8.2 NMR".

Saturday, May 10, 2008

Happy Mother's Day

a Happy Mother's Day to All

To my Burmese friends, SA and Moe: Hope you and your families are all OK.

Update (12 May 2008): Please remember the earthquake victims in Sichuan, China

Sunday, May 4, 2008

7.33 Too much oxygen?

The magnificent Brooklyn Bridge, the 5,989-ft long suspension bridge linking Brooklyn and Manhattan, opened for business on May 24, 1883, after 13 years of construction. To lay the foundation, the workers must work in caissons under the East River, with compressed air pumped in from the surface. A lot of workers suffered from decompression diseases, i.e., the "bends" which also afflict deep-sea divers if the decompression rate was too fast. Air bubbles are trapped especially in the joints causing severe pains and injuries. However, no one seemed to have complained of blurred vision during that time. Perhaps in a harsh working environment, vision was not a first priority issue. In fact, the complaint of blurred vision should probably have been noted and registered.

A 2002 report in Japan indeed shows myopia in some workers after completing 11 weeks (4 days/week) of work in pneumatic caissons. When they were examined 6 months later, a recovery towards hyperopia was found. The speculation was that this transient myopia was caused by excessive oxygen which somehow altered the structure(s) of the eye. In fact, the same myopia shift has been found in patients undergoing hyperbaric oxygen therapy.

(The inside of a hyperbaric chamber - from hyperchamber.com)
Hyperbaric oxygen therapy has a long history. It started as a treatment for the bends and logically for carbon monoxide poisoning. Now it is used to promote wound-healing and inhibit recalcitrant anaerobic bacterial infection (for example, in gangrenes). In another 2002 publication in Acta Ophthalmologica Scandinavica, with a regimen of 95-min sessions at > 95% oxygen at 2.5 atmospheres given daily Monday to Friday for a total of 30 sessions, the patients exhibited a 0.58D of myopia shift. There was no change in the axial length; although a "minimal" yet significant change in keratometric readings was noted. The investigators suspected alterations in lenticular refractive index and/or curvatures.

And in a 2006 case report from Norway: A 58-year-old man showed a hypermetropic shift, which followed the myopic shift after each of two series of treatments. The maximal refractive amplitude was 3.00 D (range -1.37 D to +1.62 D) in the right eye and 2.75 D (range -1.25 D to + 1.50 D) in the left eye. And refraction stabilized after 1.5 years to pretreatment values.

So what's going on? Given the paucity of experimental data, a reasonable speculation is a change principally in the refractive index of the lens nucleus.The best approach is probably photo-documentation with a Scheimpflug camera supplemented with ultrasound A-scan, corneal topography, and cycloplegic refraction. Scheimpflug images allow lens density as well as anterior lens thickness determination:

Some investigators have proposed that the high oxygen might have caused protein aggregation in the lens nucleus, as part of the oxidative damage, hence the increase in the refractive index. However, by and large, changes in lens protein structure are irreversible. This does not agree with the transient nature of the myopia. Alternatively, it may just be a simple increase in lens thickness owing to an increasing intake of sodium and/or loss of potassium, i.e., an ionic pump malfunction from oxygen toxicity.

All guesses. Someone out there should pick up this project.

Monday, April 28, 2008

7.32 Nutritional glaucoma

The above is Mexican poppy (botanically: Argemone mexicana) or Satyanashi. Its seeds give out a poisonous oil, the argemone oil (aka the katkar oil), which is indistinguishable from dark mustard oil.

In northern India, mustard oil is used for cooking. If some unscrupulous merchants were to adulter mustard oil with argemone oil, then an epidemic poisoning would ensue (known as Epidemic Dropsy). In fact, the first case was reported in Bombay in 1877. And more recently in Delhi in 1998 when 2,552 cases were reported and 65 died.

Sanguinarine, one of the 2 alkaloids found in argemone oil causes dilation of blood vessels/capillaries. The patients suffer general edema (i.e., dropsy) owing to leakage of plasma into the surrounding tissues. This leakage also involves the blood vessels of the uvea, thereby hindering the uveal outflow. As a result, a special form of glaucoma develops, which persists even after the poison is excluded that often requires medical/surgical intervention.

Fortunately, Epidemic Dropsy is largely a thing of the past. However, nutritional glaucoma can appear in a totally unexpected manner. In a recent case reported in Taiwan (March, 2008), a 40-year-old lady developed blurred vision with high IOP (30mmHg) - after a one-root-per-day consumption of ginseng for one month. Medicinal ginseng is quite expensive, in fact, not everyone can afford such a regimen. So, there is no epidemic here. It was speculated that high-dose ginseng might have altered the viscosity of the aqueous humor causing a sluggish outflow.
(Korean ginseng, the ones with the highest quality - the"天字第一號 (Heaven No 1)" - can fetch USD10,000 per root.)

After the ginseng runs its cause, recovery, most likely total, is expected for this particular patient. Follow-ups are of course recommended.

Sometimes the eye doctors must connect the dots and become a capable medical sleuth.